1
2
3
4
5
6
7
8
9
10
11
12
13
14
15
16
17
18
19
20
21
22
23
24
25
26
27
28
29
30
31
32
33
34
35
36
37
38
39
40
41
42
43
44
45
46
47
48
49
50
51
52
53
54
55
56
57
58
59
60
61
62
63
64
65
66
67
68
69
70
71
72
73
74
75
76
77
78
79
80
81
82
83
84
85
86
87
88
89
90
91
92
93
94
95
96
97
98
99
100
101
102
103
104
105
106
107
108
109
110
111
112
113
114
115
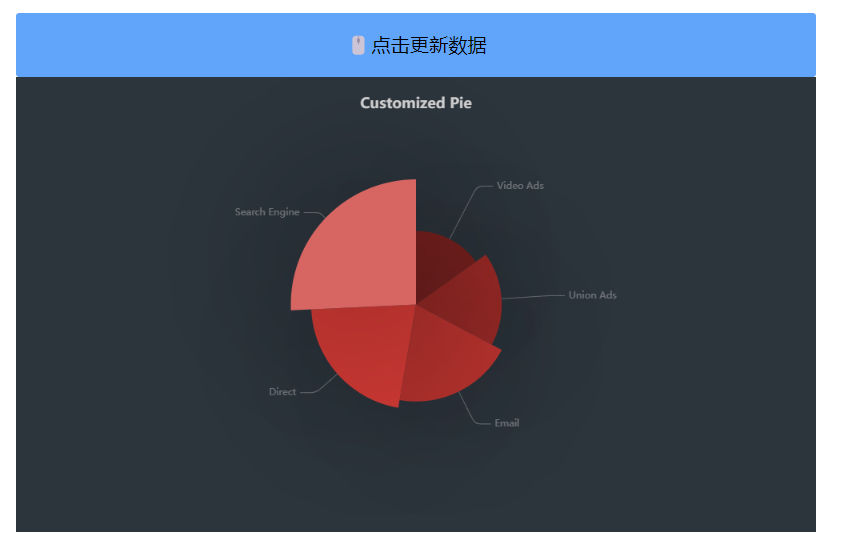
| <template>
<div class="w-full h-full">
<button class="w-1/2 h-20 rounded bg-blue-200 hover:bg-blue-400" @click="handleChangeData">
点击更新数据
</button>
<div id="chart" ref="chartContainer" class="w-1/2 h-1/2 bg-pink-200"></div>
</div>
</template>
<script setup>
import * as echarts from 'echarts'
import { onBeforeUnmount, onMounted, reactive, ref, watch } from 'vue'
const fakeData = reactive([
{ value: 335, name: 'Direct' },
{ value: 310, name: 'Email' },
{ value: 274, name: 'Union Ads' },
{ value: 235, name: 'Video Ads' },
{ value: 400, name: 'Search Engine' }
])
const chartContainer = ref(null)
let myChart = null
const initChart = () => {
if (chartContainer.value) {
myChart = echarts.init(chartContainer.value)
setChartOptions()
}
}
const setChartOptions = () => {
if (myChart) {
const option = {
backgroundColor: '#2c343c',
title: {
text: 'Customized Pie',
left: 'center',
top: 20,
textStyle: {
color: '#ccc'
}
},
tooltip: {
trigger: 'item'
},
visualMap: {
show: false,
min: 80,
max: 600,
inRange: {
colorLightness: [0, 1]
}
},
series: [
{
name: 'Access From',
type: 'pie',
radius: '55%',
center: ['50%', '50%'],
data: fakeData.sort((a, b) => a.value - b.value),
roseType: 'radius',
label: {
color: 'rgba(255, 255, 255, 0.3)'
},
labelLine: {
lineStyle: {
color: 'rgba(255, 255, 255, 0.3)'
},
smooth: 0.2,
length: 10,
length2: 20
},
itemStyle: {
color: '#c23531',
shadowBlur: 200,
shadowColor: 'rgba(0, 0, 0, 0.5)'
},
animationType: 'scale',
animationEasing: 'elasticOut',
animationDelay: (idx) => Math.random() * 200
}
]
}
myChart.setOption(option)
}
}
const handleChangeData = () => {
fakeData.forEach((item) => {
item.value = Math.floor(Math.random() * 500)
})
}
onMounted(() => {
initChart()
window.addEventListener('resize', () => myChart && myChart.resize())
})
onBeforeUnmount(() => {
window.removeEventListener('resize', () => myChart && myChart.resize())
if (myChart) {
myChart.dispose()
}
})
watch(
fakeData,
() => {
setChartOptions()
},
{ deep: true }
)
</script>
|


